
The Real Estate Game - Part 2
To help better understand the impact of various differences in changes in the interest rate, take a moment to review Table 3.1. Using a real estate loan calculator developed for Symphony Homes, the effect of changes in interest rates can be examined on a base loan of $2.5 million. The loan spread matrix illustrates how changes in the rate affect changes in the monthly payments. With a loan amount of $2.5 million and a rate of 6.25 percent, the monthly payment would be $15,392.93. By reducing the rate by 0.5 percent, the pay- ment is reduced to $14,589.32, which represents a monthly savings of $803.61 and an annual savings of $9,643.32 to the investor. The matrix allows you to quickly and easily examine the effect of changes in rate applied to different loan amounts at different rates.
|
ChartofMonthlyPayments |
|||||||
|
SampleProject,Inc.realestate.opitts2k.com |
|||||||
|
The Value Play www.opitts2k.com |
|||||||
|
Loan Amount: $2,500,000.00 |
|||||||
|
Total Interest Paid: $3,041,454.80 |
|||||||
|
Interest Rate: 6.25% |
|||||||
|
Total Amount Paid: $5,541,454.80 |
|||||||
|
Term: 360 months |
|||||||
|
Loan Amounts Incremented by $5000 |
|||||||
|
Interest Rates Incremented by 1⁄2% |
|||||||
|
Loan / Rate |
4.75% |
5.25% |
5.75% |
6.25% |
6.75% |
7.25% |
7.75% |
|
$2,475,000 |
$12,910.77 |
$13,667.04 |
$14,443.43 |
$15,239.00 |
$16,052.80 |
$16,883.86 |
$17,731.20 |
|
$2,480,000 |
$12,936.85 |
$13,694.65 |
$14,472.61 |
$15,269.79 |
$16,085.23 |
$16,917.97 |
$17,767.02 |
|
$2,485,000 |
$12,962.94 |
$13,722.26 |
$14,501.79 |
$15,300.57 |
$16,117.66 |
$16,952.08 |
$17,802.84 |
|
$2,490,000 |
$12,989.02 |
$13,749.87 |
$14,530.96 |
$15,331.36 |
$16,150.09 |
$16,986.19 |
$17,838.66 |
|
$2,495,000 |
$13,015.10 |
$13,777.48 |
$14,560.14 |
$15,362.14 |
$16,182.52 |
$17,020.30 |
$17,874.49 |
|
$2,500,000 |
$13,041.18 |
$13,805.09 |
$14,589.32 |
$15,392.93 |
$16,214.95 |
$17,054.41 |
$17,910.31 |
|
$2,505,000 |
$13,067.27 |
$13,832.70 |
$14,618.50 |
$15,423.72 |
$16,247.38 |
$17,088.52 |
$17,946.13 |
|
$2,510,000 |
$13,093.35 |
$13,860.31 |
$14,647.68 |
$15,454.50 |
$16,279.81 |
$17,122.62 |
$17,981.95 |
|
$2,515,000 |
$13,119.43 |
$13,887.92 |
$14,676.86 |
$15,485.29 |
$16,312.24 |
$17,156.73 |
$18,017.77 |
|
$2,520,000 |
$13,145.51 |
$13,915.53 |
$14,706.04 |
$15,516.07 |
$16,344.67 |
$17,190.84 |
$18,053.59 |
|
$2,525,000 |
$13,171.60 |
$13,943.14 |
$14,735.21 |
$15,546.86 |
$16,377.10 |
$17,224.95 |
$18,089.41 |
The reduction in the cost of funds by 0.5 percent has affected the value of the property. We have already established the owner would save an additional $9,643.32 each year. This means that the income stream from the property will increase by that same amount. To capitalize the value of the increase in the income stream, we simply convert the cash flow to a single capital value, as follows:
Present value of income stream = income / capitalization rate
$9,643.32 / .08 = $120,541.50
In this example, a capitalization rate, or cap rate, of 8.0 percent was assumed. Converting the additional income in this example gives us a single capital value of $120,541.50, which is a direct result of the reduction in the cost of funds by only 0.5 percent. Although it may initially seem that this would increase the value of the property, because interest payments do not affect NOI, the value of the property does not change. It does, however, affect the return on investment (ROI), since the added cash flow represents a savings to the investor, which in turn increases the rate of return. When you begin to understand the relationship between the cost of funds and its effect on value and returns, you can then begin to take full advantage of its powerful and dynamic force. Remember that all it takes is a small change in the interest rate to have a dramatic impact on the rate of return.
AMORTIZATION PERIOD
The amortization period is the second of the three secondary financing elements that affect real estate financing. While the interest paid on a loan refers to the cost of borrowing funds, the amortization period refers to the length of time used to calculate loan payments if the loan were fully amortized, or repaid, over the stated loan period.
An amortization schedule provides a list, or schedule, of the payments to be made over the life of the loan. This schedule shows the portion of each payment that is applied to principal and the portion of each payment that is applied to interest. This information is useful because it allows investors to see at a glance how much of the payment is being applied to reduce the balance of the loan at any given point over the period the loan is amortized. The shorter the amortization period, the higher the payment; conversely, the longer the amortization period, the lower the payment. Let’s look at a
simple example.
Loan amount = PV = $500,000
Interest rate = i = 6.50%
Amortization period = n = 180; payment = pmt = $4,355.54
Amortization period = n = 360; payment = pmt = $3,160.34
In this example, the difference between a 15-year loan period and a
30-year loan period is $1,195.20 per month. The question becomes, is it better to get a 15-year loan with a higher monthly payment or a 30-year loan with a lower monthly payment? I recommend using the 30-year amortization period because it provides greater flexibility. For example, if a person then wanted to apply more to the loan each month, let’s say the equivalent difference of the 15-year payment, he or she would be able to do so, but would not be obligated to do so. Since cash flow is so important in the real estate business, investors should do everything possible to minimize the monthly cash out- flows. This includes the portion paid out each month for principal and interest.
I’ve known other investors, however, whose intentions were to buy an investment property and hold it for the long term. Many of these investors preferred shorter amortization periods so they could repay an investment property’s loan more quickly. Doing so would enable them to enjoy a higher cash flow from the property once the loan was repaid. Even in situations such as this, I recommend building flexibility into the loan by using a 30-year amortization period. The investor can then pay off the loan over a shorter period of time if desired. This way the investor has the option to pay a little extra each month, but doesn’t have to. This option is especially important when a unit is vacant and no income is being generated.
Table 3.2 illustrates a monthly loan amortization schedule using $500,000 as the amount borrowed, an interest rate of 6.5 percent, a 30-year period, and a monthly prepayment of $217. Only the first 39 months are shown for the sake of brevity. Now let’s examine
This schedule illustrates the total amount applied to both interest and principal. Note how paying an additional $217 per month reduced the repayment period from 30 years to about 25 years. As has already been established, there is a trade-off when prepaying the loan since the monthly cash flow from the property is reduced by exactly the amount of additional principal paid. In this example, five years is shaved off of the total repayment schedule, but $217 per month is sacrificed in the process.
Another reason to use a longer amortization period is because, by doing so, the debt service coverage ratio (DSCR) improves. This is especially important to lenders. They want to make sure that the real estate being considered for investment purposes will generate enough cash to service the debt. In other words, lenders want and need to be assured that the real estate is throwing off enough cash on its own to repay the loan. Using a longer amortization period reduces the monthly cash outflow, which in turn leaves more cash available for the loan payment. The ratio is calculated as follows:
Debt service coverage ratio = net operating income /principal + interest = DSCR
The ratio is a simple measure of the relationship of cash generated from an investment to the debt required to pay for that investment. The minimum DSCR varies from lender to lender, but in general it can be as low as 0.75 or as high as 1.40. Most lenders look for a minimum DSCR of 1.00 to 1.20. This concept is more fully explored
|
Loan Amortization Schedule—Monthly |
|||||||
|
Loan Amount: $500,000.00 |
|||||||
|
Number of Payments: 360 |
|||||||
|
Interest Rate: 6.500% |
|||||||
|
Payment Amount: $3,160.34 |
|||||||
|
PMT |
Month |
Principal |
Interest |
Total Principal |
Total Interest |
Prepayment |
BALANCE |
|
1 |
1/1/2005 |
$669.01 |
$2,708.33 |
$669.01 |
$2,708.33 |
$217.00 |
$499,330.99 |
|
2 |
2/1/2005 |
$672.63 |
$2,704.71 |
$1,341.64 |
$5,413.04 |
$217.00 |
$498,658.36 |
|
3 |
3/1/2005 |
$676.27 |
$2,701.07 |
$2,017.91 |
$8,114.11 |
$217.00 |
$497,982.09 |
|
4 |
4/1/2005 |
$679.94 |
$2,697.40 |
$2,697.85 |
$10,811.51 |
$217.00 |
$497,302.15 |
|
5 |
5/1/2005 |
$683.62 |
$2,693.72 |
$3,381.47 |
$13,505.23 |
$217.00 |
$496,618.53 |
|
6 |
6/1/2005 |
$687.32 |
$2,690.02 |
$4,068.79 |
$16,195.25 |
$217.00 |
$495,931.21 |
|
7 |
7/1/2005 |
$691.05 |
$2,686.29 |
$4,759.84 |
$18,881.54 |
$217.00 |
$495,240.16 |
|
8 |
8/1/2005 |
$694.79 |
$2,682.55 |
$5,454.63 |
$21,564.09 |
$217.00 |
$494,545.37 |
|
9 |
9/1/2005 |
$698.55 |
$2,678.79 |
$6,153.18 |
$24,242.88 |
$217.00 |
$493,846.82 |
|
10 |
10/1/2005 |
$702.34 |
$2,675.00 |
$6,855.52 |
$26,917.88 |
$217.00 |
$493,144.48 |
|
11 |
11/1/2005 |
$706.14 |
$2,671.20 |
$7,561.66 |
$29,589.08 |
$217.00 |
$492,438.34 |
|
12 |
12/1/2005 |
$709.97 |
$2,667.37 |
$8,271.63 |
$32,256.45 |
$217.00 |
$491,728.37 |
|
13 |
1/1/2006 |
$713.81 |
$2,663.53 |
$8,985.44 |
$34,919.98 |
$217.00 |
$491,014.56 |
|
14 |
2/1/2006 |
$717.68 |
$2,659.66 |
$9,703.12 |
$37,579.64 |
$217.00 |
$490,296.88 |
|
15 |
3/1/2006 |
$721.57 |
$2,655.77 |
$10,424.69 |
$40,235.41 |
$217.00 |
$489,575.31 |
|
16 |
4/1/2006 |
$725.47 |
$2,651.87 |
$11,150.16 |
$42,887.28 |
$217.00 |
$488,849.84 |
|
17 |
5/1/2006 |
$729.40 |
$2,647.94 |
$11,879.56 |
$45,535.22 |
$217.00 |
$488,120.44 |
|
18 |
6/1/2006 |
$733.35 |
$2,643.99 |
$12,612.91 |
$48,179.21 |
$217.00 |
$487,387.09 |
|
19 |
7/1/2006 |
$737.33 |
$2,640.01 |
$13,350.24 |
$50,819.22 |
$217.00 |
$486,649.76 |
|
20 |
8/1/2006 |
$741.32 |
$2,636.02 |
$14,091.56 |
$53,455.24 |
$217.00 |
$485,908.44 |
|
21 |
9/1/2006 |
$745.34 |
$2,632.00 |
$14,836.90 |
$56,087.24 |
$217.00 |
$485,163.10 |
|
22 |
10/1/2006 |
$749.37 |
$2,627.97 |
$15,586.27 |
$58,715.21 |
$217.00 |
$484,413.73 |
|
23 |
11/1/2006 |
$753.43 |
$2,623.91 |
$16,339.70 |
$61,339.12 |
$217.00 |
$483,660.30 |
|
24 |
12/1/2006 |
$757.51 |
$2,619.83 |
$17,097.21 |
$63,958.95 |
$217.00 |
$482,902.79 |
|
25 |
1/1/2007 |
$761.62 |
$2,615.72 |
$17,858.83 |
$66,574.67 |
$217.00 |
$482,141.17 |
|
26 |
2/1/2007 |
$765.74 |
$2,611.60 |
$18,624.57 |
$69,186.27 |
$217.00 |
$481,375.43 |
|
27 |
3/1/2007 |
$769.89 |
$2,607.45 |
$19,394.46 |
$71,793.72 |
$217.00 |
$480,605.54 |
|
28 |
4/1/2007 |
$774.06 |
$2,603.28 |
$20,168.52 |
$74,397.00 |
$217.00 |
$479,831.48 |
|
29 |
5/1/2007 |
$778.25 |
$2,599.09 |
$20,946.77 |
$76,996.09 |
$217.00 |
$479,053.23 |
|
30 |
6/1/2007 |
$782.47 |
$2,594.87 |
$21,729.24 |
$79,590.96 |
$217.00 |
$478,270.76 |
|
31 |
7/1/2007 |
$786.71 |
$2,590.63 |
$22,515.95 |
$82,181.59 |
$217.00 |
$477,484.05 |
|
32 |
8/1/2007 |
$790.97 |
$2,586.37 |
$23,306.92 |
$84,767.96 |
$217.00 |
$476,693.08 |
|
33 |
9/1/2007 |
$795.25 |
$2,582.09 |
$24,102.17 |
$87,350.05 |
$217.00 |
$475,897.83 |
|
34 |
10/1/2007 |
$799.56 |
$2,577.78 |
$24,901.73 |
$89,927.83 |
$217.00 |
$475,098.27 |
|
35 |
11/1/2007 |
$803.89 |
$2,573.45 |
$25,705.62 |
$92,501.28 |
$217.00 |
$474,294.38 |
|
36 |
12/1/2007 |
$808.25 |
$2,569.09 |
$26,513.87 |
$95,070.37 |
$217.00 |
$473,486.13 |
|
37 |
1/1/2008 |
$812.62 |
$2,564.72 |
$27,326.49 |
$97,635.09 |
$217.00 |
$472,673.51 |
|
38 |
2/1/2008 |
$817.03 |
$2,560.31 |
$28,143.52 |
$100,195.40 |
$217.00 |
$471,856.48 |
|
39 |
3/1/2008 |
$821.45 |
$2,555.89 |
$28,964.97 |
$102,751.29 |
$217.00 |
$471,035.03 |
Loan Amortization Schedule—Annual
Loan Amount: $500,000.00
Interest Rate: 6.500%
Number of Payments: 360
Payment Amount: $3,160.34
Year Period Principal Interest Total Payment
1 Jan–Dec 2005 $8,271.63 $32,256.45 $40,528.08
2 Jan–Dec 2006 $8,825.58 $31,702.50 $40,528.08
3 Jan–Dec 2007 $9,416.66 $31,111.42 $40,528.08
4 Jan–Dec 2008 $10,047.30 $30,480.78 $40,528.08
5 Jan–Dec 2009 $10,720.18 $29,807.90 $40,528.08
6 Jan–Dec 2010 $11,438.12 $29,089.96 $40,528.08
7 Jan–Dec 2011 $12,204.17 $28,323.91 $40,528.08
8 Jan–Dec 2012 $13,021.51 $27,506.57 $40,528.08
9 Jan–Dec 2013 $13,893.60 $26,634.48 $40,528.08
10 Jan–Dec 2014 $14,824.07 $25,704.01 $40,528.08
11 Jan–Dec 2015 $15,816.85 $24,711.23 $40,528.08
12 Jan–Dec 2016 $16,876.14 $23,651.94 $40,528.08
13 Jan–Dec 2017 $18,006.37 $22,521.71 $40,528.08
14 Jan–Dec 2018 $19,212.30 $21,315.78 $40,528.08
15 Jan–Dec 2019 $20,498.97 $20,029.11 $40,528.08
16 Jan–Dec 2020 $21,871.82 $18,656.26 $40,528.08
17 Jan–Dec 2021 $23,336.63 $17,191.45 $40,528.08
18 Jan–Dec 2022 $24,899.53 $15,628.55 $40,528.08
19 Jan–Dec 2023 $26,567.11 $13,960.97 $40,528.08
20 Jan–Dec 2024 $28,346.32 $12,181.76 $40,528.08
21 Jan–Dec 2025 $30,244.75 $10,283.33 $40,528.08
22 Jan–Dec 2026 $32,270.28 $8,257.80 $40,528.08
23 Jan–Dec 2027 $34,431.48 $6,096.60 $40,528.08
24 Jan–Dec 2028 $36,737.42 $3,790.66 $40,528.08
25 Jan–Dec 2029 $38,221.21 $1,330.26 $39,551.47
AMOUNT OF FUNDS BORROWED
The amount of funds borrowed is the last of the three secondary financing elements that affect real estate financing. The amount of funds borrowed, or loan amount, is the amount of money being borrowed to finance an investment. The relationship between the loan amount and the down payment is an inverse relationship. As the amount of money being borrowed for an investment property increases, the amount applied toward the down payment decreases;
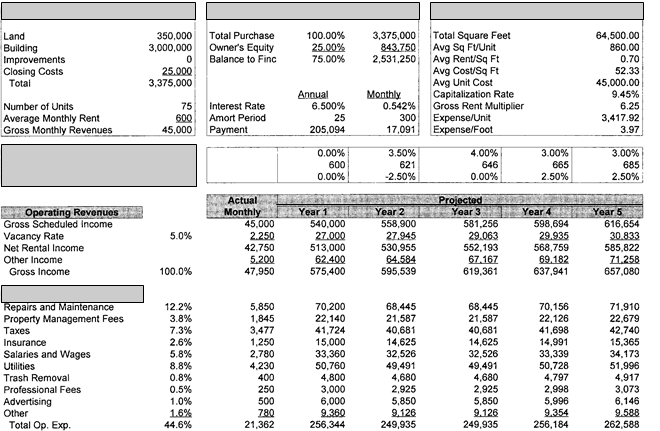
![]() Table ScenarioI: 5 Year
Pro Forma Income Statement As of January 1st
Table ScenarioI: 5 Year
Pro Forma Income Statement As of January 1st
CostandRevenueAssumptions FinancingAssumptions KeyRatios
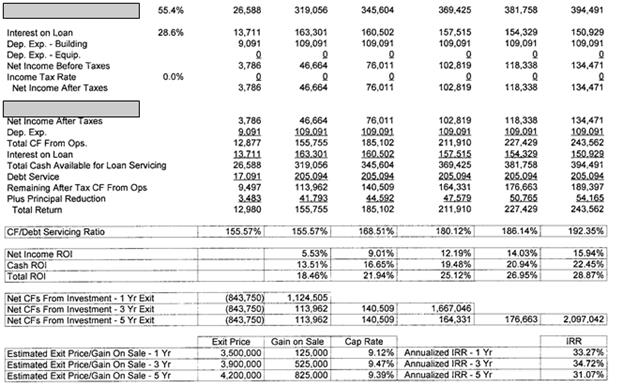
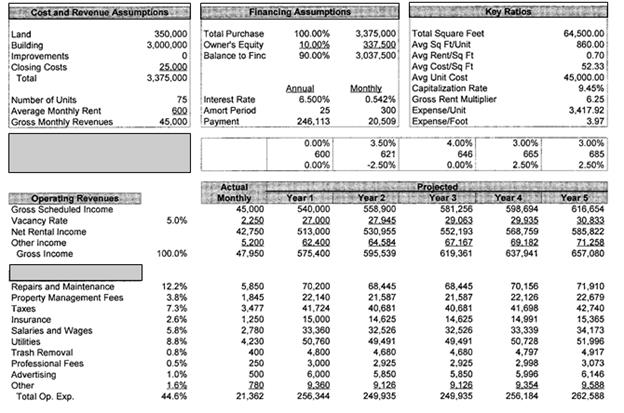
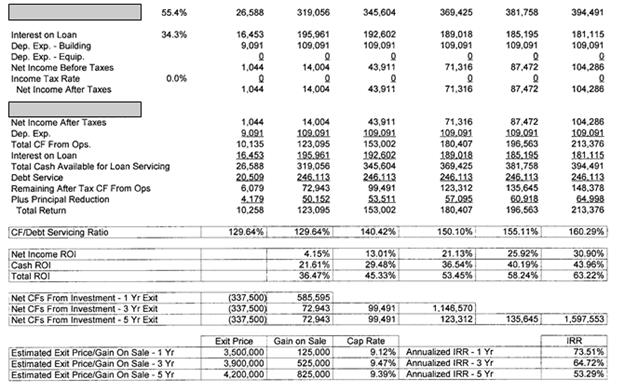
Table ScenarioII: 5 Year Pro Forma Income Statement As of January 1s
SampleProject,Inc.realestate.opitts2k.com
The Value Play www.opitts2k.com
Loan Amount Interest Rate Payments Points Payment Total Paid Cost of Loan Cost of Points
$1,000,000.00 0.07% 240 0% $7,752.99 $1,860,717.45 $860,717.45 $0.00
$1,000,000.00 0.07% 240 1% $7,603.64 $1,834,873.62 $824,873.62 $10,000.00
$1,000,000.00 0.07% 240 2% $7,455.73 $1,809,375.53 $789,375.53 $20,000.00
$1,000,000.00 0.06% 240 3% $7,309.28 $1,784,227.69 $754,227.69 $30,000.00
$1,000,000.00 0.06% 240 4% $7,164.31 $1,759,434.54 $719,434.54 $40,000.00
$1,000,000.00 0.06% 240 5% $7,020.84 $1,735,000.42 $685,000.42 $50,000.00
The break-even point can be calculated by dividing the cost of points over the savings per month. In this example, the break-even point is calculated as follows:
Breakeven = cost of points/ monthly savings
$50,000
= ——— = 68.29 months
($7,752.99 − $7,020.84)
One additional factor to consider is what the future value of the
$50,000 applied toward the discount points would be if it were instead used to purchase another investment property. We have already established that over a 20-year investment horizon, buying the interest rate down by applying the $50,000 would save $125,717.03 over and above all other costs. The question becomes, can the $50,000 be used to invest in another asset over a 20-year period to achieve an even greater return? To determine this, we must solve for i, which is the rate required to earn a return on the investment of $125,717.03. To set the problem up correctly, we know that $50,000 is the total amount invested, and $125,717.03 is the total amount returned. Using a financial calculator, the answer can easily be solved as follows:
Initial investment = present value = PV = $50,000 (cash flow out) Total amount returned = future value = FV = $125,717.03 (cashflow in)
Number of years = n = 20
To solve for the total return, solve for i
Interest rate = i = 4.72%
By solving for i, we discover that an investor would have to earn a return of 4.72% or greater to come out ahead. If the investor could not earn at least a 4.72% return, he would be better off paying down the interest rate with the $50,000, assuming, of course, that the property will be held for the 20-year duration.
Now let’s assume the investor has an alternative choice, which is to invest the $50,000 in a small multifamily apartment building. Let’s also keep the math very simple by assuming he is able to purchase a building with only 10 percent down, which is not at all an unreasonable assumption. Using this kind of leverage, the investor is able to purchase a building valued at $500,000 ($50,000 ÷ 0.10 = $500,000). Let’s also assume the investor purchased the property at a 10 cap, which means the capitalization rate is 10 percent. An apartment building with a cost of $500,000 and a cap rate of 10 will yield a net operating income (NOI) of $50,000, which is the amount of money left over after vacancy losses and operating expenses have been deducted from gross revenues. It is the portion of income avail- able to service, or pay, the debt used to finance an investment. Take a moment to review the following equations.
Price = net operating income / capitalization rate
$50,000 / 0.10 = $500,000
PV of apartment building = NOI/ cap rate
$50,000 /.10 = $500,000
Cap rate = net operating income/ price
$50,000 / $500,000 = 10.0%
Now let’s take the analysis a step further by calculating the required debt service on the $450,000 loan that was required to finance the building. We’ll also assume the investor will use the same loan pro- gram as he did with the first investment, as follows:
Loan amount = PV = $450,000
Number of years = n = 20
Interest rate = i = 7.0%
Annual debt service = pmt = $42,476.82
Let’s take a moment to recap. We have established that the investment of $50,000 in a $500,000 apartment building will yield $50,000 of NOI and will be used to pay the annual debt service of $42,476.82. Where does that leave us? Let’s take a look.
$50,000.00 − $42,476.82 = $7,523.18 = remaining cash
= cash return on investment
$7,523.18/$50,000.00 = 15.05% cash ROI
In this example, the investor would earn a cash ROI of about 15 percent, which compares favorably to the 4.72 percent return if the same $50,000 were used to buy down the interest rate. It is important to note also that the cash ROI does not reflect the added value of the tax savings resulting from depreciation, nor does it reflect the added value of a reduction in the principal balance, or loan balance, that occurs over the life of the loan. In summary, it appears that our investor will fare much better by investing the $50,000 in an apartment building than by buying down the interest rate on the purchase of his first investment property.
Mortgage brokers earn the majority of their income from the fees generated by placing loans. Since they are not direct lenders, brokers do not earn anything from the interest being charged. Interest is paid to the lender and not to the broker. A mortgage broker is similar to a real estate broker in that they are both compensated only when they sell something. Both types of brokers are paid on a percentage basis. While the real estate agent is paid a commission, the mortgage broker is paid points. Brokers typically charge between 1 and 2 percent of the loan amount, sometimes more and sometimes less. Factors that may affect the fees they charge are items such as the borrower’s creditworthiness, the size of the loan, and their ability to receive back-end fees from the lender. Don’t be fooled by brokers who charge 1 percent on a $100,000 loan amount and tell you they are making only $1,000 on the transaction. Brokers are almost always compensated by the lender for differences in the spread of the rate charged. For example, if the base rate a lender charges is 6.00 percent with zero points to the borrower, the broker will likely be paid a back-end fee of 1 percent by the lender. If the broker is able to sell the same loan to you at, let’s say 6.25 percent, the broker can double his or her income on the loan and receive 2 percent from the lender. Both front-end and back-end fees are legally required to be disclosed on the good faith estimate. Borrowers have a right to know how much they are being charged for the lender’s services. If you’re an investor with good credit and have a strong personal financial statement, mortgage brokers are less likely to play such games with you. You’re probably familiar with the term caveat emptor, but just in case you’re not, the literal translation means “buyer beware” or “let the buyer beware.” In the case of loan fees, however, I sup- pose we could say “let the borrower beware.”
Points are often made available to borrowers to buy down the interest rate applied to a loan. Since one point is equivalent to 1 per- cent, an investor paying one point on a $100,000 loan would pay $1,000 in additional up-front fees. For every point paid, the interest rate on the loan is decreased by approximately 1⁄8 to 1⁄4 of a percent. This is only a general guideline, as rate spreads vary widely among lenders, but the lender you are working with can usually provide an exact quote by looking at rate sheets. Since rate spreads are dynamic and change with minor fluctuations in the market, the rate quoted may be good for just that particular moment, or it may be good for the remainder of the day.
Take a moment to review Table 4.1. In this example, six different rate scenarios are compared. The loan amount of $1 million and the term of 240 months are held constant, while the interest rate and the points are changed in each scenario. A base interest rate of 7.00 per- cent with zero points is applied on the first line. In each subsequent rate scenario, the interest rate is decreased in quarter-point increments while simultaneously increasing the amount of discount points paid by the borrower. In the first example, an investor who borrows $1 mil- lion and pays no points and holds the loan throughout the duration of its 20-year life would pay a total of $1,860,717.45, with a monthly payment of $7,752.99. In the last example, the investor borrows the same $1 million for the same 20-year period, but instead elects to pay five discount points to buy the rate down from 7.00 percent to 5.75 percent. The investor in this scenario would pay a total of $1,735,000.42, which includes the $50,000 for points paid, and would have a monthly payment of $7,020.84. Buying down the rate in this example would save the investor $732.15 per month and $125,717.03
Effect of Leverage on Invested Capital Applying Annual
![]() Appreciation Only
Appreciation Only
Purchase Price: $500,000
![]() Percent Down: 100.0%
Down
Payment: $500,000
Percent Down: 100.0%
Down
Payment: $500,000
Number Annual Appreciation Rate
of Years 5.0% Ret on Inv 10.0% Ret on Inv 20.0% Ret on Inv
|
1 |
525,000 |
5.0% |
550,000 |
10.0% |
600,000 |
20.0% |
|
2 |
551,250 |
10.3% |
605,000 |
21.0% |
720,000 |
44.0% |
|
3 |
578,813 |
15.8% |
665,500 |
33.1% |
864,000 |
72.8% |
|
4 |
607,753 |
21.6% |
732,050 |
46.4% |
1,036,800 |
107.4% |
|
5 |
638,141 |
27.6% |
805,255 |
61.1% |
1,244,160 |
148.8% |
|
6 |
670,048 |
34.0% |
885,781 |
77.2% |
1,492,992 |
198.6% |
|
7 |
703,550 |
40.7% |
974,359 |
94.9% |
1,791,590 |
258.3% |
|
8 |
738,728 |
47.7% |
1,071,794 |
114.4% |
2,149,908 |
330.0% |
|
9 |
775,664 |
55.1% |
1,178,974 |
135.8% |
2,579,890 |
416.0% |
|
10 |
814,447 |
62.9% |
1,296,871 |
159.4% |
3,095,868 |
519.2% |
|
11 |
855,170 |
71.0% |
1,426,558 |
185.3% |
3,715,042 |
643.0% |
|
12 |
897,928 |
79.6% |
1,569,214 |
213.8% |
4,458,050 |
791.6% |
|
13 |
942,825 |
88.6% |
1,726,136 |
245.2% |
5,349,660 |
969.9% |
|
14 |
989,966 |
98.0% |
1,898,749 |
279.7% |
6,419,592 |
1183.9% |
|
15 |
1,039,464 |
107.9% |
2,088,624 |
317.7% |
7,703,511 |
1440.7% |
|
16 |
1,091,437 |
118.3% |
2,297,486 |
359.5% |
9,244,213 |
1748.8% |
|
17 |
1,146,009 |
129.2% |
2,527,235 |
405.4% |
11,093,056 |
2118.6% |
|
18 |
1,203,310 |
140.7% |
2,779,959 |
456.0% |
13,311,667 |
2562.3% |
|
19 |
1,263,475 |
152.7% |
3,057,955 |
511.6% |
15,974,000 |
3094.8% |
|
20 |
1,326,649 |
165.3% |
3,363,750 |
572.7% |
19,168,800 |
3733.8% |
|
21 |
1,392,981 |
178.6% |
3,700,125 |
640.0% |
23,002,560 |
4500.5% |
|
22 |
1,462,630 |
192.5% |
4,070,137 |
714.0% |
27,603,072 |
5420.6% |
|
23 |
1,535,762 |
207.2% |
4,477,151 |
795.4% |
33,123,686 |
6524.7% |
|
24 |
1,612,550 |
222.5% |
4,924,866 |
885.0% |
39,748,424 |
7849.7% |
|
25 |
1,693,177 |
238.6% |
5,417,353 |
983.5% |
47,698,108 |
9439.6% |
This simple example does not even take into consideration the effect of income generated, tax benefits, or principal reduction.
If you don't start pulling your weight around here its going to be shape up, or... ship up.
Hola, is Rosa still alive? No? Well this is not my day. Look at us, crying like a couple of girls on the last day of camp. Great, now I'm gonna smell to high heaven like a tuna melt! Te quiero. English, please. I love you! Great, now I'm late. Perhaps an attic shall I seek.
Hola, is Rosa still alive? No? Well this is not my day. Look at us, crying like a couple of girls on the last day of camp. Great, now I'm gonna smell to high heaven like a tuna melt! Te quiero. English, please. I love you! Great, now I'm late. Perhaps an attic shall I seek.